I’ve been in love with Leaflet ever since v0.4 was released. Well-documented, clean API included, beautiful controls and tons of plugins makes it my number one choice to create a web map. I wrote a Google Maps API app used at edpp.cz a year and a half ago and I’ve been thinking of refactoring it since then. I don’t think I even knew Leaflet existed back in those days.
I used to use Google Maps as my primary tool for web maps, it used to be the only choice back then. OpenLayers API documentation was one of the worst docs I have ever read (alphabetic sorting, please!), thus making it a no-go for me. It looked ugly and was sort of overwhelmed with functions. Leaflet came out completely different and I decided to rewrite our main map app using this great open-source library.
My first control
 Modularity is one of the things I like the most about Leaflet. I was struggling with creating checkboxes used to toggle layers in Google Maps app, it comes ready with Leaflet. Adding a control to the map is easy as piece of cake, you do
 L.Control.extend({)} and that’s it (almost). Since the map displays animated radar images showing the precipitation that occurred during last three hours or so I thought it would be great implementing this as a control: a button used to toggle the animation on/off and displaying the time currently shown image was created at.
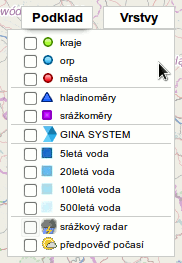
The image on the left side displays the old solution using Google Maps. It was using a lot of DOM manipulation, was quite hard to maintain and definitely not eye-candy. When the animation was turned on, another control popped up in the map’s top left corner displaying the time the image was taken at. The animation toggle (srážkový radar) was incorporated into the layer control. I decided to take it out and make it a separate feature of the map.
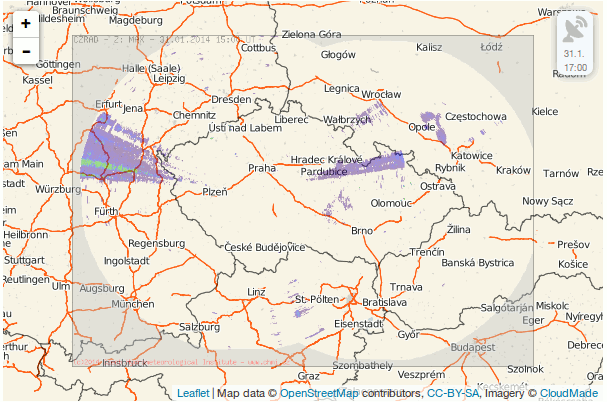
 You can see the result in the image below. The control is a simple button with the radar icon displaying the time when active. It is only useful for the Czech Republic and is highly dependent on the image provider (CHMI), which means that if the URL of the images was to be changed, the whole control would break.
You can grab the code if you like. You add the control to the map as any other control:
var radar = new L.Control.Radar();
radar.addTo(map);
You can set the control visibility with visible property passed into options of the control.
 Modularity is one of the things I like the most about Leaflet. I was struggling with creating checkboxes used to toggle layers in Google Maps app, it comes ready with Leaflet. Adding a control to the map is easy as piece of cake, you do
  You can see the result in the image below. The control is a simple button with the radar icon displaying the time when active. It is only useful for the Czech Republic and is highly dependent on the image provider (